A critique of Optimizely
Optimizely is an experimetation platform that offers 2 main services: configuring experiments (traffic splitting, treatment group assignment) and statistical analyses of the configured experiments. Here I outline several limitations, mainly with the analysis part, with using Optimizely. I admit freely here that I don’t consider myself to have fully internalized Optimizely’s statistical methods, so a few of the things you see below might simply be my misunderstanding.
Motivations behind Optimizely’s statistical methods
Optimizely uses a rather complicated statistical inference process that supposedly allows for continuous monitoring, efficient detection of any treatment effect, while guaranteeing that all inferences made in the process are statistically valid. Several main rationales are given for using such a procedure:
- Users want to monitor their experiments continuously and stop the experiment as soon as some effect is detected. This “peeking” inflates the false positive error rate when traditional statistical methods are used.
- Designing an experiment in the traditional sense (power calculation, sample size calculation, when to look at the results, etc.) is hard and involves too much guessing.
While these motivations sound great on paper (and make for a great sales pitch to non-stats savvy audiences like engineers and PMs), my experience with experimentation systems and experimenters/users reveal that these issues are rather minor.
Continuous monitoring is unwarranted
Experimenters are busy people. Regardless of whether they’re engineers, product managers, or data scientists, they are most likely juggling multiple code bases, products, and projects. I’ve never seen anyone who launches an experiment and twiddles their thumbs while it runs, unable to do anything until the experiment is conclusive. The need to continuously monitor the experiment seems to be more imagined than real. I should note that monitoring the experiment for signs that something goes terribly wrong (usually by checking that the main KPIs do not tank) is recommended. But this doesn’t require fancy statistics.
Immediate launch of the winning variant is unwarranted
Most experiments are not mission-critical, i.e., they’re not going to give a 10% lift to your KPI metrics. A majority of experiments do not show any improvement, and among those that do, the improvements tend to be modest, around the range of 0.5%~2%. While these numbers are only ballpark, they should make sense. Experiments are intended to further optimize the business - they’re not meant to fundamentally change the business (there are exceptions). As such, their effects are marginal.
So would experimenters drop everything and launch a winning feature once some positive effect is detected? No. And there are good reasons, statistics and significance aside, for not doing so.
- Since the effects are marginal, waiting for a few more weeks is not a big deal.
- Statistical significance isn’t everything. Experimenters want to have a good estimate of the treatment effect. Leaving the experiment to run over the intended duration allows for more data to be gathered, providing more confidence around what the true effect size is.
- Post-hoc analyses of other metrics - there is typically interest in knowing how additional metrics moved, or how certain segments of users behaved. Having more data definitely helps with these analyses. I should note that thorough analysis of important experiments can yield very important and actionable insights into user behavior, which would in turn spur development of additional improvements.
Guesswork in sample size calculation can be fine
Experiments are a way for the business to move forward, hopefully optimally. They’re not an exercise in precise science - that would be reserved for the likes of clinial trials for FDA approval where the impact of a wrong decision can be extremely costly. As such, some degree of guesswork is perfectly fine.
In practice, experimenters have limited tolerance for long experiments. The most common durations used are 2 weeks, 4 weeks, 6 weeks. These lengths come from the culture of the company, the personal experience of the experimenters, business domain expert knowledge, and often also the need to move fast. The experimenter would usually aim for a specific length, say 4 weeks, and try to get as much traffic as possible by using all allowed parts of the site, areas of service, etc. At the end of 4 weeks, it’s over, significant or not. There are good reasons for doing so. First, if the results are significant, then all’s well and good. Second, if the results are not significant, then one can conclude that the true treatment effects are small enough for the business to be ignored. The continuous monitoring framework would allow the experimenter to extend the experiment duration - statistically that might be fine, but in terms of business impact it sounds like spending more time hoping for a very small effect.
So what do experimenters really care about?
- The experiment is configured correctly: traffic is being channeled as expected, giving the right ratio of control population size to treatment population size.
- The assignment is as good as random: any checks that can be done to verify that there’s no systematic bias between control and treatment groups.
- Removal of pre-existing biases: if there are pre-existing biases (these sometimes happen even when assignment is random), there should be a procedure to remove such biases from final treatment effect estimate.
As far as I can tell (though my knowledge is likely outdated), Optimizely doesn’t provide any of these reassuring features.
Flaws with Optimizely’s statistical method
It is too complicated and not reproducible
A complaint I hear again and again about Optimizely’s experiment results is that experimenters don’t understand them, and can’t reconcile them with their own analysis. Granted that many experimenters are engineers and product managers who aren’t statistically savvy, but as many experimenters are data scientists with some statistical training. They would resort to traditional statistics like t-test, Mann Whitney, etc., and see that their results are different from Optimizely’s. Alas, they can’t really see where Optimizely’s numbers come from, because its methods are proprietary.
This above issue is more serious that it sounds. A proponent of Optimizely might say: “Hey - these methods have been developed by experts in the field, statisticians with Ph.D.s, at prestigious universities.” But that would have little sway in a product review meeting where the in-house data scientist isn’t able to explain the discrepancies, or why some metrics move in this direction whereas others move in the opposite direction. Like I write above, statistical significance isn’t everything. Understanding the experiment results, being able to reason about them and therefore trust them, is orders of magnitude more important.
Statistical flaws and limitations
Now, there is some information about Optimizely’s methods that the data scientist can attempt to piece together to try to reproduce. I have included such information I could find in the references section below. After studying these white papers several times over, and I shamelessly admit that I still haven’t quite internalized their contributions (I even watched an hour-long YouTube presentation by one of the authors), let me provide a summary of its methods (as far as I can glean from these papers) and some criticisms.
Summary of procedure
Optimizely uses an inference method that relies on a likelihood ratio test. In a nutshell, it calculates the ratio of (a) the likelihood that the treatment effect $\theta$ is some non-zero value $\tilde \theta$ to (b) the likelihood that the treatment effect is zero. However, ex-ante it is not known what the treatment effect might be, so Optimizely calculates the average likelihood ratio over possible values over a distribution $\pi(\theta)$. It then compares this average likelihood ratio to some threshold that is calibrated to give the right type I error (size, false positive rate), and as much power as possible.
Limited power
The authors behind Optimizely’s method write that if you stick to a sample size in advice, then finite-horizon statistics is optimal: “the probability of detecting any true effect with the predetermined data set is maximized.” A corollary of this is that the continuous monitoring/sequential testing approach can’t give more power than finite-horizon approach. We can unpack this by considering 3 cases. Case 1: the treatment effect is so large that it will be detected by either method. Case 2: the treatment effect is so small and negligible that neither method detects it. Case 3: the treament effect is small, detectable by finite horizon statistics but not by sequential testing. From an experimenter’s perspective, finite horizon statistics would seem more favorable because it can detect a wider range of treatment effects.
The above argument should make sense as one thinks about the tradeoffs between power and monitoring. In traditional frequentist statistics, one can monitor the experiment by looking at the data in the interim (often called interim analysis or group sequential testing). But in doing so one has to impose stricter thresholds for the test statistic in order to control the the false positive rate, thus reducing the ability to detect smaller treatment effects. Continuous monitoring is no different - in order to monitor, one has to impose more stringent standards for what constitutes “significance.”
Unclear hypotheses being tested in an unclear framework
It is not crystal clear what hypotheses are being tested. My best guess is that this procedure tests the alternative hypothesis $H_a$ that $\theta\neq 0$ against the null hypothesis $H_0$ that $\theta = 0$. However, in the process, a prior of $N(0, \tau)$ is being used. Is this prior part of the null hypothesis, or the alternative hypothesis? Or both?
In a traditional framework, there is a clear set up
- Some distributional assumption is made on the data generating process, given the parameter
- Under the null, a test statistic would have certain distribution
- Reject the null if the test statistic turns out to be very unlikely given its distribution under the null
Overall, the null hypothesis serves as the anchor for claims about what a test statistic should look like. By having both the null hypothesis and a prior distribution, it is very confusing what exactly is being tested, and based on what assumptions.
Edit: perhaps Optimizely is testing the alternative of $\theta \sim N(0, \tau)$ against the null of $\theta = 0$. If so, it’s a strange comparison - a specific continuous random distribution against a single value with probability mass 1. It’s like meshing Bayesian with frequentist in an obscure way. In addition, rejecting the null lands you with the alternative that $\theta \sim N(0, \tau)$, so does that mean that the true effect can be zero? Hmm…
It is partially Bayesian inference, without the main benefits of Bayesian inference
For a long time I was confused whether Optimizely’s methods are frequentist or Bayesian. I think it’s fair to say that it’s a mixture of both. Below are instances in the papers where a prior is used in the computation.
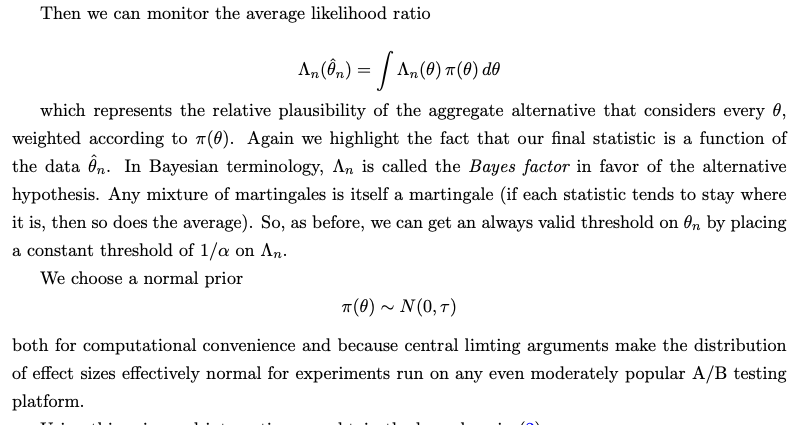
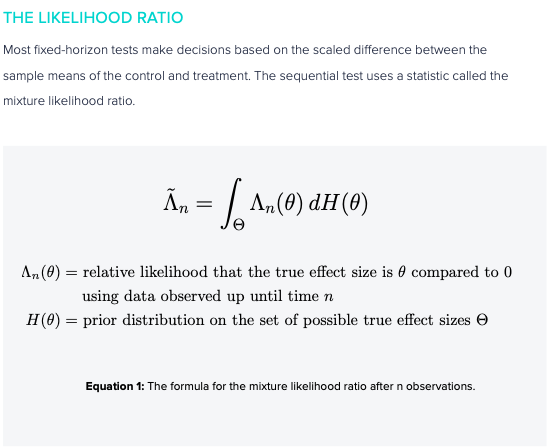
Optimizely uses a normal prior $\pi(\theta) \sim N(0, \tau)$ and calibrates the parameter $\tau$ “as the result of extensive analysis of historical experiments run on Optimizely’s platform. It should be noted that without this personalization, sequential testing did not give results quickly enough to be a viable for use in an industry platform. This is something we intend to keep refining going forward.”
The fusion of Bayesian elements confuses me for many reasons.
- Typically a prior is used to capture knowledge about the parameter. This knowledge tends to be domain specific. But Optimizely seems to be using all experiments on its platform to calibrate this prior. It’s practically lumping priors on auto part defects with grocery shopper purchase amounts. This pooling makes little sense to me, and in essence loses the benefits of Bayesian inference - the ability to augment the data with domain specific expert knowledge.
- If one is willing to specify a prior, then it would be way simpler to adopt a full Bayesian approach: (1) specify a prior, (2) update the prior with data to obtain a posterior (3) make decisions based on the posterior distribution (e.g., stop when the posterior distribution is sufficiently far from zero). From a Bayesian perspective, peeking doesn’t create any problem - the posterior is always valid.
- There is inherent subjectivity in the choice of the prior, $\tau$. Optimizely itself states that it’s going to “refine” this. In other words, the statistical significance of an experiment results might change depending on $\tau$. This is an inconsistency that experimenters would not welcome.
Technical quibbles
A common estimation procedure in statistics is called Maximum Likelihood Estimation (MLE). Given data, it looks for the parameter value over a parameter space that maximizes the likelihood of seeing the data. Testing of a null hypothesis can be done by looking at the ratio of the likelihood at the maximizing parameter value $\hat \theta$ to the likelihood at the parameter value specified by the null (e.g., $\theta = 0$). If this ratio is large, it can be used as evidence against the null.
The intuition of this procedure is clear: given the data, it’s likely that the true parameter is around the maximizing value $\hat \theta$, and if the parameter value under the null makes the data much less likely, then we should probably reject the null. This procedure has long-established statistical foundations.
Optimizely’s technique seems to be a rather simple yet odd modification of this idea. Instead of using the maximum likelihood, one now uses the weighted average likelihood over some parameter space. It’s hard to make much intuition out of this. I can give it a try: there is some average likelihood of seeing the data, and if the parameter value under the null makes the data much less likely, then we should reject the null. Hmm…
References
Optimizely stats engine white paper